Chart Settings
After defining the data (X-axis and value) at section 6.1, then we can define the Chart. We can choose which chart type, and some configuration
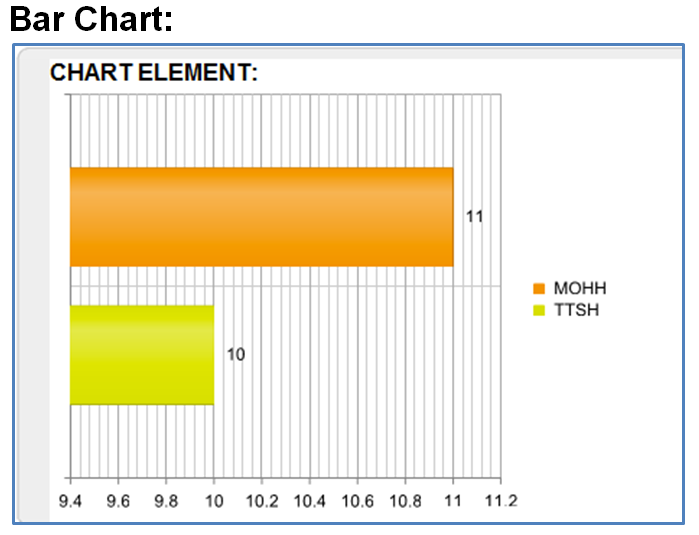
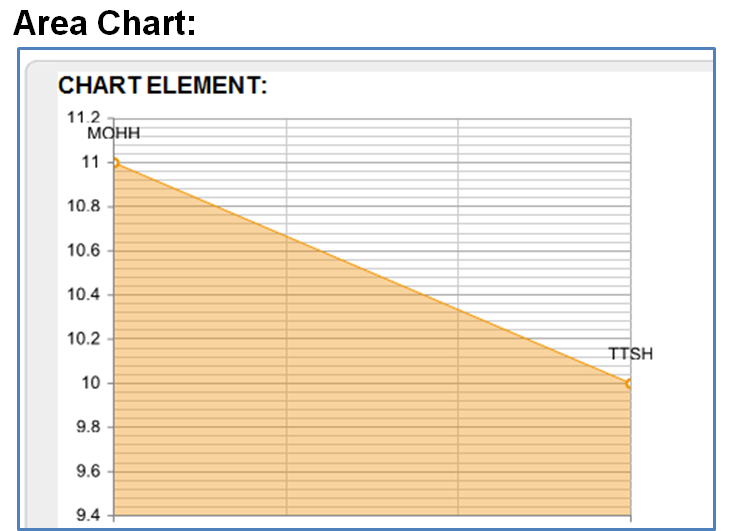
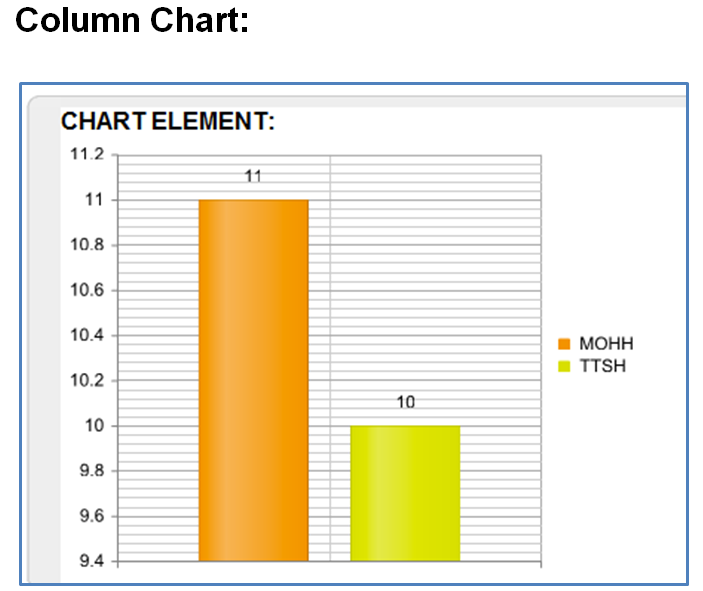
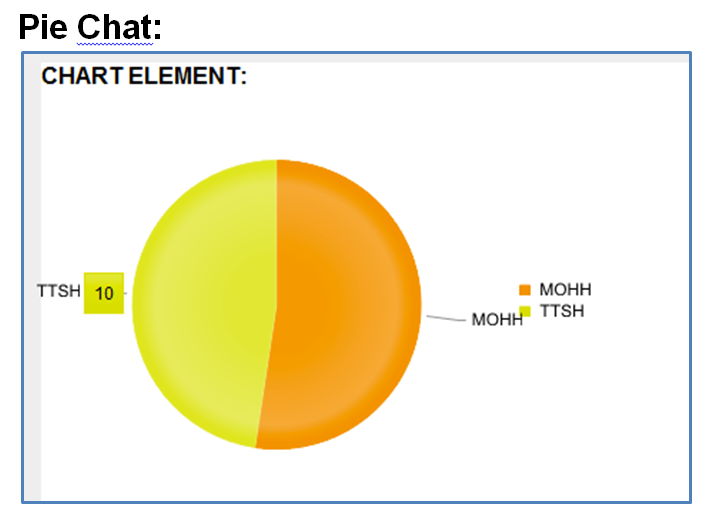
Following are supported Chart type:
- Bar
- Area
- Column
- Pie

In above setting, we define the chart as Bar Chart. We also show the Legend.
Below is the sample of Chart: